
Obesity Statistics in America 2026: Rates, Costs, Health Impact & Treatment Trends
Obesity Statistics in America 2026: Rates, Costs, Health Impact & Treatment Trends
The most comprehensive obesity statistics resource for America in 2026. Covers US adult and childhood obesity rates, $445 billion economic burden, health consequences, demographic disparities, and how GLP-1 medications are changing outcomes for the first time in decades.
Obesity remains one of the most significant public health challenges in the United States. More than 100 million American adults are currently living with obesity — a condition that increases the risk of type 2 diabetes, heart disease, hypertension, sleep apnea, and certain cancers. At the same time, 2026 brings an important shift: for the first time in recorded history, the US adult obesity rate is showing a sustained decline — directly linked to the widespread adoption of GLP-1 receptor agonist medications.
US Adult Obesity Rates 2026
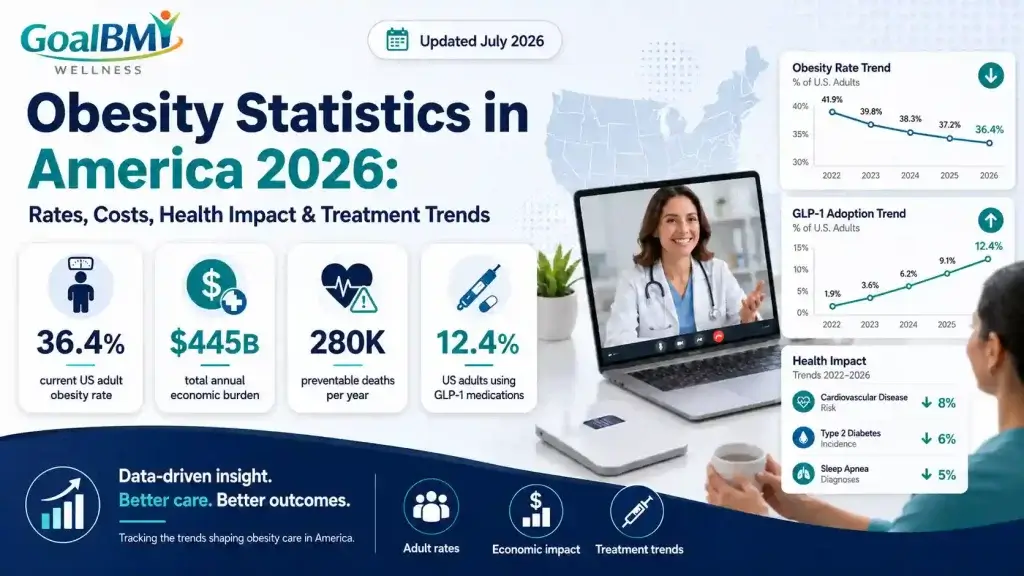
More than 2 in 5 American adults currently have obesity. The 2026 data shows the first sustained decline from the historic 2022 peak — a trend researchers directly attribute to expanded GLP-1 medication use.
First Sustained Decline in US Obesity Rate in Decades
The US adult obesity rate peaked at an all-time recorded high of 39.9% in 2022. By June 2026, Gallup’s health survey estimated the rate had fallen to 36.4% — the lowest since 2018. Researchers have directly linked this decline to the widespread adoption of GLP-1 medications, with 12.4% of US adults now using them. This represents the first time a pharmacological intervention has produced a measurable population-level decline in obesity rates. (Source: Gallup, June 2026)
Severe Obesity — A Distinct and Growing Concern
Beyond general obesity (BMI ≥ 30), severe obesity (BMI ≥ 40) affects a significant and growing share of Americans. The CDC’s August 2021–August 2023 NHANES data found severe obesity affected approximately 9.7% of US adults — nearly 1 in 10. Patients with severe obesity carry significantly higher health risks and often benefit most from physician-supervised GLP-1 programs combined with structured lifestyle interventions.
Obesity Rates by State — Where GoalBMI Wellness Serves
Obesity rates vary significantly by state. The Northeast and West Coast generally show lower rates than the South and Midwest — but all states carry a substantial obesity burden. Here is where the states GoalBMI Wellness serves stand:
| State | Adult Obesity Rate | Adults Affected (Est.) | vs. National Avg. | GLP-1 Access via GoalBMI |
|---|---|---|---|---|
| New York | 28.1% | ~3.8 million | Below avg ✓ | Available |
| New Jersey | 28.4% | ~2.1 million | Below avg ✓ | Available |
| Connecticut | 28.0% | ~830,000 | Below avg ✓ | Expanding |
| Pennsylvania | 34.4% | ~3.6 million | Near national avg | Available |
| National Average | ~36–40% | 100+ million | — | — |
| Highest (Mississippi) | ~40.8% | ~960,000 | Far above avg | — |
| Lowest (Colorado) | ~24.2% | ~1.2 million | Lowest in US | — |
Obesity by Demographics — Race, Gender & Income
Obesity does not affect all Americans equally. Significant disparities exist across racial and ethnic groups, income levels, and geographic areas — reflecting broader social determinants of health.
By Race and Ethnicity
By Income Level
The income-obesity relationship is particularly pronounced in children. According to the National Survey of Children’s Health (NSCH) 2022–2023, children in the lowest income group had obesity rates more than double those of children in the highest income group. This pattern persists into adulthood. (Source: Forbes Health, 2026)
Health Consequences of Obesity — What the Data Shows
Obesity is not simply a weight issue — it is a chronic disease that significantly increases the risk of multiple serious health conditions. The clinical data on obesity-related comorbidities is unambiguous.
Obesity Increases Type 2 Diabetes Risk by 80% or More
Observational studies consistently show that obesity increases the risk of developing type 2 diabetes by 80% or more. Furthermore, 85% to 90% of all type 2 diabetes cases are attributed to modifiable factors — with overweight and obesity being the leading contributors. This makes weight loss one of the most powerful interventions available for diabetes prevention and management. (Source: WifaTalents, 2026)
Hypertension Affects 58% of Adults With Obesity
Hypertension (high blood pressure) is the single most common comorbidity in adults with obesity, affecting an estimated 58% of adults with obesity — more than 58 million Americans. This comorbidity drives enormous cardiovascular risk and contributes billions of dollars in healthcare costs annually. (Source: The World Data, 2026)
280,000 Preventable Deaths Annually From Obesity
Obesity is responsible for an estimated 280,000 preventable deaths per year in the United States, making it one of the leading preventable causes of mortality. Effective weight loss — whether through lifestyle changes, medication, or combination treatment — is directly associated with reduced mortality risk across all major obesity-related conditions. (Source: WorldMetrics.org, 2026)
Comorbidity Conditions at a Glance
Economic Cost of Obesity in America 2026
The financial burden of obesity extends far beyond individual medical bills — it affects employers, insurance systems, government programs, and the broader economy. The numbers are staggering.
People With Obesity Pay $1,861 More Per Year in Medical Costs
Individuals with obesity spend an estimated $1,861 more per year on medical care than people at healthy weight — and some estimates put this higher at $2,500 annually. Obesity-attributable medical costs represent a direct financial burden on patients and families in addition to the broader systemic costs. (Source: The World Data, 2026 / SingleCare, 2026)
Global Obesity Costs to Reach $18 Trillion by 2060
If current trends continue globally, the World Obesity Federation estimates the economic impact of overweight and obesity will grow to $3 trillion per year by 2030 and $18 trillion annually by 2060. A US-specific PubMed model (2025) projects that obesity alone will cost the US healthcare system $20.4 trillion from 2023 to 2060 in direct costs. (Source: PubMed, 2025)
Childhood Obesity Statistics 2026
Childhood obesity is a significant public health concern in the United States, with approximately 1 in 5 children affected. Early onset of obesity significantly increases the likelihood of adult obesity and associated health complications.
Income is the Strongest Predictor of Childhood Obesity Risk
The National Survey of Children’s Health found that children living below the poverty level had an obesity rate of 24.1% — more than double the rate of 10.4% seen in children from families at four times the poverty level. This income gradient makes childhood obesity one of the most inequality-driven health conditions in the United States. (Source: Forbes Health, 2026)
GLP-1 Medications — How Treatment Is Changing Obesity Statistics
For the first time in the modern obesity epidemic, clinical pharmacology is producing measurable population-level changes in obesity rates. GLP-1 and GIP receptor agonists represent a fundamental shift in how obesity is treated — from a lifestyle challenge to a manageable chronic medical condition.
Before & After — GLP-1 Weight Loss Results at GoalBMI Wellness
These results reflect real patients who completed physician-supervised semaglutide and tirzepatide programs through GoalBMI Wellness. Clinical outcomes are consistent with what the SURMOUNT-1 and STEP-1 trials showed — meaningful, sustained weight loss under medical supervision.

Results disclaimer: Individual results may vary. Photos represent real patients from physician-supervised GoalBMI Wellness programs and are shared with patient consent. Results depend on individual health factors, adherence to the prescribed program, and medical evaluation. GLP-1 medications require a licensed provider evaluation and prescription.
GoalBMI Wellness Program Pricing — What Does Treatment Cost?
Cost is one of the most frequently cited barriers to accessing physician-supervised weight loss programs. GoalBMI Wellness offers transparent self-pay pricing with insurance verification assistance for patients who may qualify for coverage.

Context: TrumpRx Pricing — November 2025
In November 2025, the Trump administration announced a negotiated pricing agreement with Eli Lilly and Novo Nordisk, reducing brand-name tirzepatide and semaglutide to $245 per month through the TrumpRx program — less than half of prior prices. GoalBMI Wellness also works with licensed 503A compounding pharmacies to offer cost-effective options for eligible patients when appropriate. View our full program pricing page for current self-pay rates.
The Obesity Epidemic — Key Timeline
Frequently Asked Questions
Sources & Medical References
- 1CDC / NHANES (2024). Prevalence of obesity and severe obesity among adults: United States, August 2021–August 2023. cdc.gov
- 2Gallup Health Survey (June 2026). US Adult Obesity Rate and GLP-1 Usage Survey, n=5,065. gallup.com
- 3WorldMetrics.org (May 2026). Obesity in America Statistics — 100 verified facts. worldmetrics.org
- 4The World Data (June 2026). US Obesity Statistics in 2026: Rates, Comorbidities & Costs. theworlddata.com
- 5SingleCare (March 2026). Obesity in America: Statistics and Facts 2026. Medically reviewed by Karen Berger, Pharm.D. singlecare.com
- 6Forbes Health (June 2026). Obesity Statistics & Facts in America 2026. forbes.com
- 7WifaTalents (February 2026). 2026 Obesity In America Statistics — 40+ Verified Facts. wifitalents.com
- 8Journal of Medical Economics / PubMed (2025). The evolving burden of obesity in the US: system dynamics approach 2023–2060. pubmed.ncbi.nlm.nih.gov
- 9World Obesity Federation (2023). Global economic impact of overweight and obesity projected through 2035. worldobesity.org
- 10Jastreboff A.M., et al. (2022). Tirzepatide Once Weekly for the Treatment of Obesity (SURMOUNT-1). NEJM, 387(3), 205–216. doi.org/10.1056/NEJMoa2206038
- 11Wilding J.P.H., et al. (2021). Once-Weekly Semaglutide in Adults with Overweight or Obesity (STEP-1). NEJM, 384(11), 989–1002. doi.org/10.1056/NEJMoa2032183
- 12NIH / NIDDK (2024). Overweight & obesity statistics. niddk.nih.gov

-
Monday – Friday:: 9:00 AM – 8:00 PMSaturday:: 9:00 AM – 4:00 PMSunday:: 12:00 PM – 8:00 PM