
Type 2 Diabetes Statistics 2026 | Prevalence, Costs & GLP-1 Outcomes
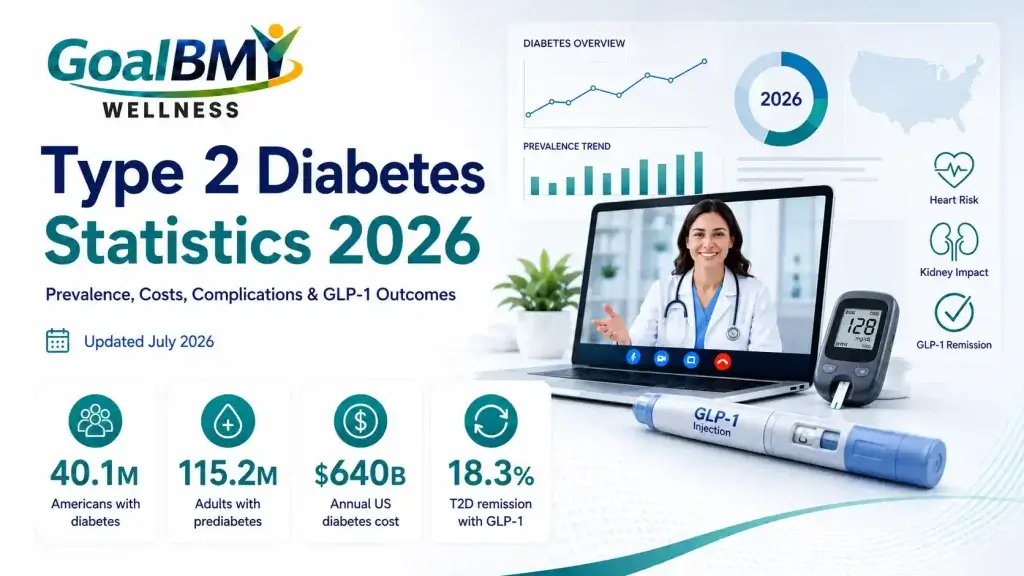
Type 2 Diabetes Statistics 2026: Prevalence, Costs, Complications & How GLP-1 Treatment Is Changing Outcomes
The most comprehensive type 2 diabetes statistics resource for 2026. Covers US prevalence and prediabetes data, the $640 billion economic burden, health complications by the numbers, demographic disparities, and how GLP-1 receptor agonists are producing measurable diabetes remission for the first time.
Type 2 diabetes has become the most expensive chronic disease in the United States — and it is still growing. More than 40 million Americans are currently living with it, another 115 million are on the path toward it, and every year 1.5 million new cases are diagnosed. But 2026 also marks a genuine inflection point: GLP-1 receptor agonist medications are now producing measurable diabetes remission at rates that would have seemed implausible ten years ago.
The Scale of the Problem — How Many Americans Have Diabetes Right Now
Diabetes affects more Americans than any single disease outside of obesity itself — and the two conditions are deeply intertwined. The January 2026 CDC National Diabetes Statistics Report provides the most current snapshot available.
Over Half of US Adults Have Either Prediabetes or Diabetes
When prediabetes is included, the picture becomes even more stark. 52% of US adults — more than 1 in 2 — have either type 2 diabetes or prediabetes. Given that most people with prediabetes are unaware of it, the true burden of glucose dysregulation in America is vastly underappreciated. (Source: American College of Cardiology, May 2026)
Younger Americans Are Not Exempt
Nearly 1 in 5 adolescents aged 12–18 and 1 in 4 young adults aged 19–34 already have prediabetes. Diabetes complications — historically associated with older adults — are now increasing among adults aged 18–44. Type 2 diabetes in younger populations carries a longer lifetime complication window and historically more aggressive progression. (Source: CDC NCCDPHP, 2026)
115 Million Americans With Prediabetes — What the Window of Opportunity Looks Like
Prediabetes is not a warning sign on the horizon — it is a current clinical state affecting 42.6% of all US adults. It is also the most actionable stage: the evidence is clear that progression to type 2 diabetes is not inevitable.
GLP-1 Medications Are Now ADA First-Line for All T2D Patients
The American Diabetes Association’s 2025 Standards of Medical Care recommend GLP-1 receptor agonists as first-line glucose-lowering medications for all patients with type 2 diabetes — not just those who have failed other treatments. The primary goal is achieving a healthy weight. This represents a fundamental shift in how diabetes is managed clinically. As of 2026, 12% of all US adults are now using a GLP-1 medication. (Source: ADA Standards 2025; ACC, May 2026)
The $640 Billion Price Tag — Where America’s Diabetes Spending Goes
Diabetes is the most expensive chronic condition in the United States — by a wide margin. The CDC calculates total annual diabetes costs at $640 billion in medical spending and lost productivity, and that figure is still rising.
$20.4 Trillion Projected Through 2060 — If Nothing Changes
A 2026 PubMed systems dynamics analysis projected that if current trends continue, direct obesity-attributable healthcare costs alone will reach $20.4 trillion cumulatively between 2023 and 2060, with a 73% rise in BMI-related mortality resulting in 31 million excess cumulative deaths. The same model found that preventing progression from overweight to obesity class I would avoid 25 million obesity cases by 2060 and save $1.21 trillion in direct medical costs. (Source: PubMed Systems Dynamics Analysis, 2026)
30% of All US Hospital Inpatient Spending Goes to Diabetes Patients
Thirty percent of total US medical expenditures for diabetes patients goes to hospital inpatient care. Another 30% goes to prescription drugs for managing diabetic complications — separate from antidiabetic agents, which account for another 15%. The pattern reflects how much of the $640 billion is reactive care rather than prevention. (Source: CDC NCCDPHP, ADA, 2026)
Who Bears the Highest Burden — Demographic Disparities by Age, Race and Education
Type 2 diabetes does not affect all Americans equally. The CDC data reveals substantial differences by age, race, ethnicity, and education level that reflect broader social determinants of health.
| Group | Diabetes / Prediabetes Prevalence | Notes |
|---|---|---|
| Adults aged 65+ | 28.8% diagnosed diabetes | Also highest prediabetes rate at 48.8% |
| Adults aged 40–59 | 46.4% prediabetes or T2D | Highest combined burden of any age group |
| Adults aged 20–39 | 35.5% prediabetes | Rising T2D complications in this group |
| Black adults | Higher prevalence vs. White adults | 41 states/territories ≥35% obesity BRFSS |
| Hispanic adults | Elevated prevalence | Multiple contributing social and dietary factors |
| High school diploma or less | 44.6% obesity rate | vs. 31.6% in those with bachelor’s degree or higher |
| Americans in the Midwest | 35.9% adult obesity rate | Highest regional obesity burden |
| West Virginia | 41.4% adult obesity | Highest state rate — 16.4 pt gap vs. Colorado (25%) |
What Untreated Diabetes Does to the Body — Complication Statistics
The $640 billion in annual costs is not abstract — it maps directly onto what diabetes does to the body over time when blood glucose is not well controlled. These are the complication rates the medical literature consistently reports.
Cardiovascular Disease Is the Leading Cause of Death in T2D Patients
Adults with type 2 diabetes have a 2 to 4 times higher risk of cardiovascular events than adults without diabetes. Diabetes damages blood vessels and nerves that control the heart, making cardiovascular disease the primary cause of death in this population. This is also why the SELECT trial result — semaglutide reducing cardiovascular events by 20% in adults with obesity — carries such clinical significance. (Source: NIH NIDDK, 2026)
Diabetes Is the Leading Cause of New Blindness and Kidney Failure
Diabetic retinopathy is the leading cause of new cases of blindness in adults 20–74. Diabetes is also the leading cause of kidney failure in the United States, accounting for approximately 44% of new cases each year. Nerve damage affects approximately 50% of people with diabetes over their lifetime. These complications are not inevitable — but they require glucose control, blood pressure management, and regular monitoring that requires a physician. (Source: CDC; NIH NIDDK, 2026)
How GLP-1 Medications Are Reshaping the Type 2 Diabetes Landscape
The relationship between GLP-1 receptor agonists and type 2 diabetes is foundational — these medications were originally developed as diabetes drugs. Ozempic® (semaglutide) and Mounjaro® (tirzepatide) remain FDA-approved for type 2 diabetes, while their weight management versions (Wegovy® and Zepbound®) address the primary driver of T2D.
GLP-1 in Older Adults With Uncontrolled T2D — Real-World Results
A retrospective study of 30 older adults (ages 65–84) with uncontrolled type 2 diabetes (initial HbA1c 9.6%–12.6%, BMI 27–48.2) who started GLP-1 agonist therapy since 2022 showed HbA1c reduced to 5.8%–7.7% and BMI reduced to 23–39.8 during treatment. These results represent clinically significant improvements in glycemic control alongside meaningful weight reduction — in a population traditionally considered challenging to treat. (Source: NIH PMC / Indiana University, 2023)
📖 Related GoalBMI Wellness Programs & Resources
Type 2 Diabetes Remission — From Rare to Clinically Achievable
Diabetes remission — defined as maintaining HbA1c below 6.5% for at least three months — was once considered achievable only through bariatric surgery. GLP-1 medications have fundamentally changed that picture.
Early Intervention Produces the Best Remission Results
The Lancet analysis found remission was most common in patients with shorter diabetes duration and higher BMI — not the most advanced cases. This confirms what the weight loss research also shows: the earlier a patient with obesity and glucose dysregulation begins supervised GLP-1 treatment, the better the remission probability. Waiting for diabetes to worsen before treating reduces the likelihood of remission significantly.
Most Patients Who Stop Treatment Return to Active Use Within Three Years
A large population-based study of 73,895 new GLP-1 users found that while 38.5% discontinued at three years, 57.4% of those who discontinued reinitiated within three years — meaning most patients who stop do come back. Among those continuously on treatment, the proportion with active treatment remained 70–80% across a 1–5 year period. The pattern supports treating GLP-1 therapy as long-term disease management rather than a short-term fix. (Source: NIH PMC, 2025)
Progress Markers — Population-Level T2D Data
Physician-Supervised Diabetes & Weight Loss Programs — What Access Looks Like
For patients with type 2 diabetes, prediabetes, or obesity driving glucose dysregulation, GoalBMI Wellness offers physician-supervised GLP-1 programs entirely through telehealth — with insurance verification and transparent self-pay pricing.

Programs available via telehealth across New York, New Jersey, and Pennsylvania.
Before & After — GLP-1 Outcomes in Physician-Supervised Programs
These results are from real GoalBMI Wellness patients in physician-supervised GLP-1 programs. Weight reduction at the 10–15% threshold — the level identified by the ADA as sufficient for diabetes remission potential — is achievable under structured clinical supervision.

See more patient before & after results →
Results disclaimer: Individual results may vary. Photos represent real patients from physician-supervised GoalBMI Wellness programs shared with patient consent. Results depend on individual health factors, program adherence, and clinical evaluation.
Questions Patients and Providers Ask Most Often About T2D in 2026
Explore the Full GoalBMI Statistics Series
📊 All 2026 Statistics Reports
Sources & Medical References
- 1CDC (January 2026). National Diabetes Statistics Report. Diagnosed and undiagnosed diabetes prevalence. diabetes.org
- 2CDC NCCDPHP (2026). Health and Economic Benefits of Diabetes Interventions. $640B cost, prediabetes figures. cdc.gov
- 3CDC (2026). Fast Facts: Health and Economic Costs of Chronic Conditions. cdc.gov
- 4NIH NIDDK (2026). Diabetes Statistics. Direct medical costs, complications data. niddk.nih.gov
- 5American College of Cardiology (May 2026). Prioritizing Health: Diabetes, Diet and GLP-1 Receptor Agonists. ADA 2025 Standards, 52% combined prevalence. acc.org
- 6The Lancet Regional Health — Europe (2025). Type 2 diabetes remission after initiation of GLP-1 receptor agonists. Remission rates 5.8%–18.3%. thelancet.com
- 7NIH PMC (2025). Treatment discontinuation among users of GLP-1 receptor agonists and SGLT2 inhibitors — 73,895 patients. ncbi.nlm.nih.gov
- 8NIH PMC / Indiana University (2023). GLP-1 agonists: Effect in management of diabetes and weight loss in older adults. 30-patient cohort. ncbi.nlm.nih.gov
- 9PubMed (2026). The evolving burden of obesity in the US: a novel population-level system dynamics approach. $20.4T projected cumulative cost 2023–2060. pubmed.ncbi.nlm.nih.gov
- 10Solv Health (May 2026). U.S. Obesity Statistics and Facts in 2026. CDC NHANES data — demographics by age, sex, education. solvhealth.com
- 11The Global Statistics (June 2026). Diabetes Statistics and Facts in the U.S. 2026 — prediabetes by age, 38% adult prediabetes rate. theglobalstatistics.com
Medically Reviewed by Karla K. Mioduchoski, FNP-BC
Karla K. Mioduchoski, FNP-BC is a board-certified Family Nurse Practitioner providing physician-supervised medical weight loss, GLP-1 support, peptide therapy, and telehealth wellness care through GoalBMI Wellness. All statistical data in this article was reviewed for clinical accuracy in July 2026.



-
Monday – Friday:: 9:00 AM – 8:00 PMSaturday:: 9:00 AM – 4:00 PMSunday:: 12:00 PM – 8:00 PM